
Comparative Incidence of Fungal Pathogens in Common Bean Seeds from Formal and Informal Sources
-
Samwel I. Sengele

Tanzania Official Seed Certification Institute, P.O.BOX 1056, Morogoro, Tanzania
Danstan MsuyaDepartment of Crop Science and Horticulture, College of Agriculture, Sokoine University of Agriculture, P.O.Box 3005, Morogoro, Tanzania
Paul NjauDepartment of Crop Science and Horticulture, College of Agriculture, Sokoine University of Agriculture, P.O.Box 3005, Morogoro, Tanzania
| Received 14 Dec, 2025 |
Accepted 14 Apr, 2026 |
Published 20 May, 2026 |
Background and Objective: The common bean (Phaseolus vulgaris L.) is the most important grain legume for human consumption and plays a vital role in the livelihoods of smallholder farmers in Tanzania, serving as both a food security crop and a source of income. This study aims to determine the incidence of fungal pathogens in common bean seeds obtained from both formal and informal sources. Materials and Methods: Common bean seed samples were collected from formal and informal sources across six districts in Tanzania’s Southern Highlands. Seed health was analyzed using the standard blotter method under ISTA protocols to detect seed-borne fungi. A total of 72 seed lots were tested, and fungal identification was based on morphological features using microscopy. Infection incidence and frequency were calculated, and data were statistically analyzed using ANOVA and Tukey’s test at 5% significance level. Results: The 22 fungal species, including 18 pathogenic and 4 non-pathogenic fungi. All the 22 fungal species were detected in farm-saved seed samples, 9 in QDS seeds, and only 3 in certified seeds. Farm-saved seeds showed the highest fungal incidence, with a total incidence of 95% for samples collected from Sumbawanga district. The highest incidence of pathogenic fungi in farm-saved seeds was recorded in Kilolo district, with an incidence of 26%. In QDS seeds, the highest incidence was 25.5% in a sample from Mbozi district, while certified seeds had the lowest fungal contamination, with a maximum incidence of 22%. The lowest fungal contaminations in certified seeds as compared to QDS and Farm saved seeds may be attributed to difference in certification requirement in all seed categories where certification is stricter in certified seeds compared to QDS and there is no certification at all done in Farm saved seeds. Conclusion: The farm saved seeds have high risk of fungal contaminations, therefore farmers must be emphasized on the use of quality certified seeds so as to avoid the risk of seed borne diseases in their field and hence improving productivity.
| Copyright © 2026 Sengele et al. This is an open-access article distributed under the Creative Commons Attribution License, which permits unrestricted use, distribution, and reproduction in any medium, provided the original work is properly cited. |
INTRODUCTION
The common bean (Phaseolus vulgaris L.) is the most important grain legume for human consumption. It plays a principal role in the livelihoods of smallholder farmers in Tanzania as a food security and source of income crop1. It is the most important grain legume in human diet worldwide, but mainly in Africa and Latin America, where it provides a cheap source of dietary protein2. It is grown in about 28 mL hectares and feeds more than 500 mL people in Africa and Latin America alone3. It is commonly consumed for its delicacy, high protein content and as a source of certain antioxidants, minerals, and polyphenols4. In addition, common beans are an excellent source of starch, dietary fibre, vitamins, and minerals. The nutritional and production attributes of the common bean make it a potential crop for improving the nutritional security of poor communities. The seeds of legumes are second only to cereals as an important source of food for humans and animals5. Common beans have the potential of reducing poverty and increasing food security on smallholder farms if critical constraints to production are addressed6.
Despite being a very important crop, in many areas bean yields are still below average (0.5-0.6 ton/ha). In comparison, the yield potential of improved bean varieties in Tanzania is 1.5 to 3.5 ton/ha using proper crop and land husbandry7,8, the global average yield of common bean is 715 kg/ha. The main reasons for the low yield obtained by most smallholders are: poor seed quality, poor performance of the local landraces, mainly due to their susceptibility to pests and diseases, low soil fertility, poor crop management, such as late weeding, and currently drought9.
The suboptimal yield of common beans in Tanzania, as in numerous other regions, is linked to a range of disease challenges that have a detrimental impact on crop productivity and quality. These diseases may stem from fungal, bacterial, viral, or other pathogenic sources10. Among the diseases that constrain bean production, seed-borne diseases play a leading role, and it is estimated that they cause 80-100% yield loss of common bean on farms11.
Of all transmissible seed-borne diseases of common beans, fungi cause the most damage, which includes seed rots, seed discoloration, and shrinking seeds, amongst others12. The present study was undertaken to find out the seedborne fungi of common beans from common bean seed samples obtained from formal and informal seed sources to contribute to the development of sustainable management strategies in bean production aimed at minimizing yield losses due to fungal diseases.
MATERIALS AND METHODS
Study area: Seed samples were collected from formal and informal seed sources in the Southern highland parts of Tanzania in June 2023. This area is located at a latitude of 9.1667°S, 34.5167°E and an altitude of 1500 to 2000 m above sea level, which comprises Iringa, Njombe, Ruvuma, Mbeya, Songwe, Rukwa, and Katavi Regions. The annual rainfall in this area ranges from 823 mm on the Ufipa Plateau up to 2,850 mm on the slopes of Mount Rungwe and the Livingstone and Poroto mountains facing Lake Malawi, with an average of 900 mm. Rainfall is mostly during the November through April wet season, although higher elevations experience mists and light rain during the May through August dry season. Temperatures of the area vary depending on the season, with average minimum and maximum of 17 and 28°C, respectively (TMA, 2012).
Sample collection: About one kilogram of seed was collected from 72 seed lots of farm saved, QDS, and Certified seed categories, which represent Formal and Informal seed sources. The seed samples were collected from six districts of the southern highland zone of Tanzania, which are Rungwe (Mbeya), Mbozi (Songwe), Kilolo (Iringa), Njombe DC (Njombe), Madaba (Ruvuma), and Sumbawanga (Rukwa) districts. Four seed samples from each seed category were collected from each district, which makes a total of 12 seed samples collected per district. The seed samples collected were immediately taken to the African Seed Health Centre laboratory at Sokoine University of Agriculture for seed health quality analysis.
|
|
Laboratory tests: All common bean seed samples collected were analyzed for seed health by using ISTA protocols for seed health testing (ISTA, 2001) at the African Seed Health Centre, found at Sokoine University of Agriculture.
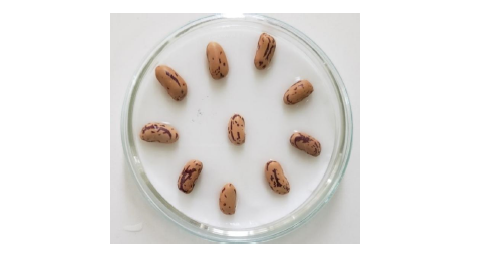
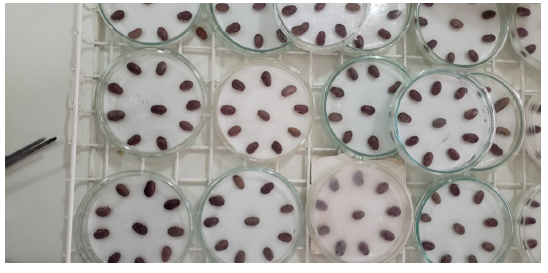
Seed testing method used: Identification of fungi: The standard blotter method developed by Doyer in 1938 and later included in the International Seed Testing Association Rules of 200513 was used in the identification of seed-borne fungal pathogens in this study to detect and identify fungal pathogens. Four replicates of 200 seeds per treatment were plated for fungal detection. Three pieces of Whatman filter papers of 90 mm size were moistened with distilled water and placed in 90 mm sterilized Petri dishes. After draining excess water, untreated seeds were placed at the rate of 10 seeds per Petri dish at equal distance (Fig. 1), twenty Petri dishes were plated with 10 common bean seeds each to represent the replicates of a treatment and these were arranged in completely randomized design (Fig. 2). The plates were incubated at room temperature (20±2°C) under alternate cycles of 12 hrs near ultra violet (NUV) light and darkness. After seven days of incubation, each seed was observed under a stereomicroscope in order to identify the seed-borne fungi. Most of the associated fungi were detected by observing their growth characteristics on the incubated seeds. Temporary slides were also prepared and observed under a compound microscope for proper identification. The fungi were identified to species level, wherever possible, following the keys of Mathur and Kongsdal14. The number of infected seeds was recorded with their respective fungal pathogens.
Identification of fungi was based on morphological characteristics of fungi observed with the aid of microscope and fungal identification key.
Data analysis: The seed health testing results were used to calculate the infection incidence and infection frequency15, which were calculated as follows:
The number of contaminated seeds was obtained for each sample and was used to calculate the incidence of contamination for each sample and fungal species. The infection frequency was calculated for all fungi and presented separately for samples from different seed categories.
Statistical analysis: To obtain the difference existing in fungal contamination among different seed categories, data on the incidence of contamination were subjected to Analysis of Variance (ANOVA) using GENSTAT 15thedition and Turkey’s test was used to separate the means at 5% level of significance.
RESULTS
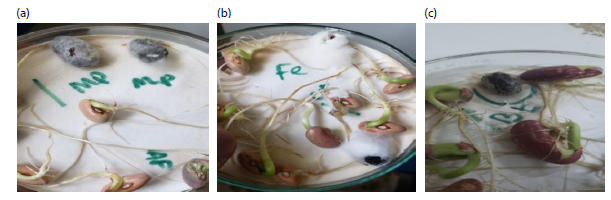
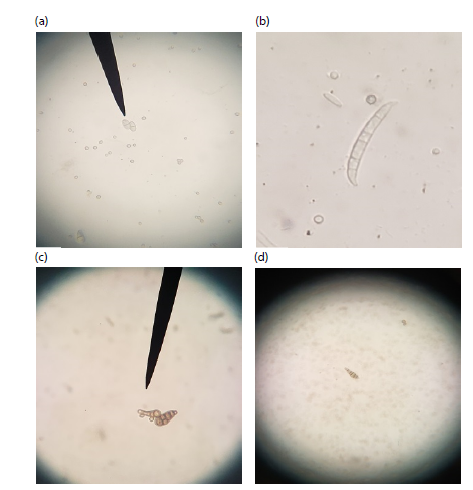
Fungal growth on plated common bean: After the period of incubation of plated common bean seeds, fungal growth was observed on the surface of the seeds (Fig. 3a-c). Growth of the fungi was recognized by the presence of mycelia emerging from the plated bean seeds. Plated grains also showed changes in colour, molding, and germination were also observed on some of the plated grains. Presence of fungal spores was noticed on the surfaces of the plated common bean grains. There was also a musty odour of the plated bean grains, which signified mold invasion. In some instances, microscope slides were prepared to observe the conidia of some pathogens using the compound microscope (Fig. 4a-d).
Incidence of fungal pathogens in bean seeds: Generally, 22 fungal species, comprising 18 pathogenic and 4 saprophytic fungi, were detected. The identified fungi were:
Aspergillus niger, Aspergillus flavus, Botrytis cinerea, Fusarium pallidoroseum, Fusarium solani, Phomopsis phaseoli, Penicillium spp., Macrophomina phaseolina, Fusarium moniliforme, Fusarium equiseti, Phomopsis vexans, Myrothecium leucotrichum, Aspergillus spp., Trichothecium roseum, Botryodiplodia theobromae, Alternaria alternata, Fusarium oxysporum, Curvularia lunata, Stemphylium botryosum, Myrothecium roridum, Colletotrichum gloeosporioides, Fusarium decemcellulare, and Fusarium subglutinans (Table 1).
|
|
| Table 1: | Fungal species detected in common bean seed samples from formal and informal sources | |||
| Disease category | Infested seed category | |||||
| Fungal species | Disease | Seed borne | Soil borne | FSS | QDS | Certified |
| Asperillus niger | N | N | Y | Y | Y | |
| Aspergillus flavus | N | N | Y | Y | Y | |
| Botrytis cinerea | Grey Mold | Y | N | Y | N | N |
| Penicillium spp. | N | N | Y | Y | Y | |
| Fusarium pallidoroseum | Fusarium wilt | Y | N | Y | Y | N |
| Fusarium solani | Fusarium root rot | Y | Y | Y | Y | N |
| Phomopsis phaseoli | Phomopsis blight | Y | N | Y | N | N |
| Macrophomina phaseolina | Charcoal rot | Y | N | Y | N | N |
| Fusarium moniliphome | Fusarium wilt | Y | N | Y | Y | N |
| Fusarium equiset | Fusarium wilt | Y | N | Y | Y | N |
| Phomopsis vexans | Pod blight | Y | N | Y | N | N |
| Myrothecium leucotrichum | Myrothecium leaf spot | Y | N | Y | Y | N |
| Aspergillus spp. | N | N | Y | Y | N | |
| Trichothecium roseum | Pink pod rot | Y | N | Y | N | N |
| Botryodiplodia theobromae | Seed rot | Y | N | Y | N | N |
| Alternaria altenata | Alternaria leaf spot | Y | N | Y | N | N |
| Fusarium oxyporum | Fusarium wilt | Y | Y | Y | N | N |
| Curvularia lunata | leaf spots | Y | N | Y | N | N |
| Stemphylium botryosum | Leaf mould | Y | N | Y | N | N |
| Myrothecium roridum | Myrothecium leaf spot | Y | N | Y | N | N |
| Colletotrichum gloeosporioides | Bean anthracnose | Y | N | Y | N | N |
| Fusarium subglutinans | Fusarium wilt | Y | N | Y | N | N |
| Fusarium decemcellurate | Fusarium wilt | Y | N | Y | N | N |
| Colletotrichum graminicola | Bean anthracnose | Y | N | Y | N | N |
| Y: Yes, N: No, FSS: Farm-saved seeds, QDS: Quality declared seeds, C: Certified seeds, Y: Yes (detected), N: No (not detected), Seed-borne: Fungus transmitted via seed and Soil-borne: Fungus transmitted via soil | ||||||
| Table 2: | Incidence of fungal pathogens detected from farm saved, QDS and Certified seed samples | |||
| Incidence (%) | |||||
| Sample number | Seed category | Districts | Pathogenic fungi | Non-pathogenic fungi | Total |
| 1 | FSS | NJOMBE | 5 | 85 | 90 |
| 2 | FSS | NJOMBE | 5.5 | 39.5 | 45 |
| 3 | FSS | NJOMBE | 14.5 | 10.5 | 25 |
| 4 | FSS | NJOMBE | 5 | 23 | 28 |
| 5 | QDS | NJOMBE | 0.5 | 10 | 10.5 |
| 6 | QDS | NJOMBE | 4 | 12 | 16 |
| 7 | QDS | NJOMBE | 2.3 | 11 | 13.3 |
| 8 | QDS | NJOMBE | 3.1 | 11.5 | 14.6 |
| 9 | C | NJOMBE | 0 | 2.5 | 2.5 |
| 10 | C | NJOMBE | 0 | 12.5 | 12.5 |
| 11 | C | NJOMBE | 0 | 7.5 | 7.5 |
| 12 | C | NJOMBE | 0 | 10 | 10 |
| 13 | FSS | MBOZI | 16.5 | 25 | 41.5 |
| 14 | FSS | MBOZI | 14 | 49.5 | 63.5 |
| 15 | FSS | MBOZI | 18.5 | 20.5 | 39 |
| 16 | FSS | MBOZI | 24 | 22 | 46 |
| 17 | QDS | MBOZI | 0 | 9.5 | 9.5 |
| 18 | QDS | MBOZI | 2 | 10.8 | 12.8 |
| 19 | QDS | MBOZI | 2 | 23.5 | 25.5 |
| 20 | QDS | MBOZI | 1.3 | 14.6 | 15.9 |
| 21 | C | MBOZI | 0 | 3 | 3 |
| 22 | C | MBOZI | 0 | 7.1 | 7.1 |
| 23 | C | MBOZI | 0 | 19 | 19 |
| 24 | C | MBOZI | 0 | 9.7 | 9.7 |
| 25 | FSS | RUNGWE | 2 | 7 | 9 |
| 26 | FSS | RUNGWE | 3.5 | 33.5 | 37 |
| 27 | FSS | RUNGWE | 9 | 4.5 | 13.5 |
| 28 | FSS | RUNGWE | 4 | 22 | 26 |
| 29 | QDS | RUNGWE | 1.7 | 19.1 | 20.7 |
| 30 | QDS | RUNGWE | 2 | 19 | 21 |
| 31 | QDS | RUNGWE | 3 | 19.5 | 22.5 |
| 32 | QDS | RUNGWE | 2 | 19.1 | 21.1 |
| 33 | C | RUNGWE | 0 | 14.4 | 14.4 |
| 34 | C | RUNGWE | 0 | 11 | 11 |
| 35 | C | RUNGWE | 0 | 5 | 5 |
| 36 | C | RUNGWE | 0 | 11.8 | 11.8 |
| 37 | FSS | KILOLO | 1 | 18 | 21.5 |
| 38 | FSS | KILOLO | 26.5 | 4.5 | 31 |
| 39 | FSS | KILOLO | 8 | 8 | 16 |
| 40 | FSS | KILOLO | 4 | 19 | 23 |
| 41 | QDS | KILOLO | 2.5 | 19.3 | 21.8 |
| 42 | QDS | KILOLO | 2.5 | 19.3 | 21.8 |
| 43 | QDS | KILOLO | 0.5 | 21 | 21.5 |
| 44 | QDS | KILOLO | 1 | 21 | 22 |
| 45 | C | KILOLO | 0 | 8 | 8 |
| 46 | C | KILOLO | 0 | 8.3 | 8.3 |
| 47 | C | KILOLO | 0 | 8.5 | 8.5 |
| 48 | C | KILOLO | 0 | 22 | 22 |
| 49 | FSS | SUMBAWANGA | 8.5 | 37.5 | 46 |
| 50 | FSS | SUMBAWANGA | 9.5 | 86 | 95.5 |
| 51 | FSS | SUMBAWANGA | 7 | 26 | 33 |
| 52 | FSS | SUMBAWANGA | 6 | 69.5 | 75.5 |
| 53 | QDS | SUMBAWANGA | 0.8 | 21 | 21.8 |
| 54 | QDS | SUMBAWANGA | 1.4 | 20.3 | 21.8 |
| 55 | QDS | SUMBAWANGA | 0.9 | 21 | 21.9 |
| 56 | QDS | SUMBAWANGA | 3.5 | 20.5 | 24 |
| 57 | C | SUMBAWANGA | 0 | 15.3 | 15.3 |
Table 1 shows an overview of fungi species identified in the seed samples obtained from formal and informal seed sources. Columns 1 and 2 show the fungal species identified and the diseases they can cause; columns 3 and 4 indicate whether the organism is seed-borne or soil-borne; columns 5-7 show whether the fungal species have been detected on farm-saved seeds, QDS seeds, or Certified seeds.
All identified fungal species (22) were detected in farm saved seed samples, 9 fungal species appeared in QDS seeds and only 3 fungal species were detected in certified seeds. Out of 22 fungal species detected in farm saved seeds, majority (18 fungal species) were pathogenic fungi while 4 were non-pathogenic fungi. Only four pathogenic fungi were detected in QDS seed samples which were Fusarium pallidoroseum, Fusarium solani, Fusarium equiset and Myrothecium leucotrichum, while only non-pathogenic fungi were detected in certified seeds samples which were Aspergillus niger, Aspergillus flavus and Penicillium species.
The FSS showed the highest fungal incidence recorded a total incidence of (95%) for sample collected from the Sumbawanga District. The highest incidence of pathogenic fungi in FSS was recorded in Kilolo District with an incidence of 26%. In QDS seed, the highest incidence was recorded from a sample obtained from Mbozi district which is 25.5% while certified seeds have the lowest fungal contamination with the highest fungal incidence being 22% (Table 2).
Frequency of occurrence of fungi isolated on common bean seed samples: Table 3 shows the frequency of each fungus isolated on different common bean seed samples in different seed categories. Aspergillus flavus showed a high percentage of occurrence across all seed categories, with 100% in QDS and certified seed categories, and 92% on FSS seeds. Certified seed samples were only infected by non-pathogenic fungi, namely Aspergillus niger, Aspergillus flavus and Penicillium spp. having frequencies of 46, 100 and 54%, respectively.
Five pathogenic fungi and four non-pathogenic fungal species were detected in QDS seed samples. The pathogenic fungal species detected with their frequency of occurrence were Fusarium pallidoroseum (88%), Fusarium solani (42%), Fusarium equiset (17%), Fusarium monilifome (21%), and Myrothecium leuvotrichum (38%).
| Table 3: | Frequency of occurrence of different detected fungal species in all seed categories | |||
| Farm saved seeds | QDS seed category | Certified seed category | ||||
| Fungal species | Infested samples |
Frequency of occurrence (%) |
Infested samples |
Frequency of occurrence (%) |
Infested samples |
Frequency of occurrence (%) |
| Asperillus niger | 14 | 58 | 21 | 88 | 11 | 46 |
| Aspergillus flavus | 22 | 92 | 24 | 100 | 24 | 100 |
| Penicilllium spp. | 9 | 38 | 14 | 58 | 13 | 54 |
| Fusarium pallidoroseum | 18 | 75 | 21 | 88 | NA | NA |
| Fusarium solani | 14 | 58 | 10 | 42 | NA | NA |
| Fusarium equiset | 7 | 29 | 4 | 17 | NA | NA |
| Myrothecium leucotrichum | 1 | 4 | 5 | 21 | NA | NA |
| Aspergillus spp. | 7 | 29 | 23 | 96 | NA | NA |
| Fusarium moniliphome | 21 | 88 | 9 | 38 | NA | NA |
| Botrytis cinerea | 6 | 25 | NA | NA | NA | NA |
| Phomopsis phaseoli | 6 | 25 | NA | NA | NA | NA |
| Phomopsis vexans | 2 | 8 | NA | NA | NA | NA |
| Macrophomina phaseolina | 5 | 21 | NA | NA | NA | NA |
| Colletotrichum graminicola | 5 | 21 | NA | NA | NA | NA |
| Trichothecium roseum | 4 | 17 | NA | NA | NA | NA |
| Botryodiplodia theobromae | 2 | 8 | NA | NA | NA | NA |
| Alternaria altenata | 1 | 4 | NA | NA | NA | NA |
| Fusarium oxyporum | 5 | 21 | NA | NA | NA | NA |
| Curvularia lunata | 1 | 4 | NA | NA | NA | NA |
| Stemphylium botryosum | 1 | 4 | NA | NA | NA | NA |
| Myrothecium roridum | 1 | 4 | NA | NA | NA | NA |
| Colletotrichum gloeosporioides | 2 | 8 | NA | NA | NA | NA |
| Fusarium subglutinans | 2 | 8 | NA | NA | NA | NA |
| Fusarium decemcellurate | 1 | 4 | NA | NA | NA | NA |
| Frequency of occurrence (%): (Number of infected samples÷Total samples tested)×100, NA: Not applicable (fungus not detected in that category), FSS: Farm-saved seeds, QDS: Quality declared seeds and C: Certified seeds | ||||||
| Table 4: | Influence of seed category on fungal contaminations | |||
| Mean fungal incidence (%) | |||
| Seed categories | Pathogenic | Non-pathogenic | Total contaminants |
| Certified | 0.00a | 10.62a | 10.63a |
| Quality declared seeds (QDS) | 1.938a | 17.10a | 19.03b |
| Farm saved seeds | 9.804b | 29.88b | 39.79c |
| Probability | <0.001 | <0.001 | <0.001 |
| S.E | 3.657 | 11.9 | 11.17 |
| LSD | 6.89 | 6.89 | 6.47 |
| C.V | 93.4 | 62 | 48.3 |
| Values followed by different letters indicate significant differences at p≤0.05 (Tukey’s test), S.E: Standard error, LSD: Least significant difference and C.V: Coefficient of variation | |||
All twenty-two fungal species were detected in FSS samples with varying frequencies of occurrence. Aspergillus flavus appeared to have highest frequency of appearance of 92% followed by Fusarium monilifome (88%) and Fusarium pallidoroseum (75%) making the top three fungi species appeared in most FSS samples.
Comparative infestation of different sources seed samples: The result of Analysis of Variance (ANOVA) showed that Incidence of fungal pathogens in the bean seed samples varied significantly at (p≤0.05) among seed categories and among different locations. Farm saved seed (FSS) seed category had the highest percentage of infected seed followed by QDS and Certified seeds. Total mean incidence was 39.79% in FSS compared to 19.03% and 10.63% for QDS and Certified seeds, respectively. The difference was seen in both Pathogenic and non-pathogenic fungal species (Table 4).
| Table 5: | Influence of locations (Districts) on fungal contaminations | |||
| Mean fungal incidence (%) | |||
| District | Pathogenic | Non-pathogenic | Total contaminants |
| Rungwe | 2.267a | 15.49ab | 17.75a |
| Sumbawanga | 3.133a | 29.76b | 32.9b |
| Njombe | 3.325a | 19.58ab | 22.91ab |
| Kilolo | 3.833a | 14.74a | 18.78a |
| Madaba | 4.4a | 17.77ab | 22.17ab |
| Mbozi | 6.525a | 17.85ab | 24.38ab |
| Probability | 0.105 | 0.04 | 0.025 |
| S.E | 3.657 | 11.9 | 11.17 |
| LSD (0.05) | 2.993 | 9.74 | 9.15 |
| C.V (%) | 93.4 | 62 | 48.3 |
| Values followed by different letters indicate significant differences at p≤0.05 (Tukey’s test). Pathogenic: Disease-causing fungi, Non-pathogenic: Saprophytic fungi, NA: Not applicable, S.E: Standard error, LSD: Least significant difference and C.V: Coefficient of variation | |||
There was also variation in fungal contaminations for seed samples collected from different districts. Seeds collected from Sumbawanga showed the highest incidence of fungal contamination with mean incidence of (32.9%) followed by Mbozi (24.38%), Njombe (22.91%), Madaba (22.17%), Kilolo (18.78%) and Rungwe (17.75%) (Table 5).
DISCUSSION
The results revealed that the diseases which undoubtedly account for the prevailing field epidemics and yield losses infect bean seeds used by farmers in Southern Highlands. Among the detected fungal species Phomopsis phaseoli and Fusarium species had also been detected in Southern highlands of Tanzania15,16. The incidence of fungal pathogens varied significantly among seed categories and geographic locations. Farm-saved seed (FSS) samples exhibited the highest diversity of fungal species, with all 22 species detected. The QDS seeds showed a lower diversity, with only 9 fungal species identified, and certified seeds had the lowest diversity, with only 3 fungal species detected. The results suggested that FSS samples may harbour a higher diversity of fungal pathogens compared to QDS and certified seeds. These findings relate to those of Ochran et al.17 who registered low fungal infection in formal soy bean seeds as compared to seed from the informal sector. High diversity of fungal species in farm saved seeds compared to QDS and Certified seeds might be due to absence of official seed quality control in FSS during and after production.
Among the identified fungal species, Aspergillus flavus was the most prevalent fungal species across all seed categories which suggest extraordinary association of Aspergillus flavus with common bean seeds. Fusarium pallidoroseum, Fusarium solani, Fusarium equiset, and Myrothecium leucotrichum were also prevalent in QDS seed samples, indicating potential risks associated with these seeds.
The results presented highlighted the varying frequency of different fungi isolated from samples across various seed categories. Notably, Aspergillus flavus emerged as a prominent colonizer, demonstrating high occurrence rate in all seed categories. This fungus was found in 100% of Quality Declared Seeds (QDS) and Certified seed samples, while it was present in 92% of Farm-Saved Seed (FSS) samples. This agrees with the study done by Francisco and Usberti18, who reported a high frequency of occurrence of A. flavus in stored common bean seeds making it the most important pathogen in terms of prevalence in common bean.
The results also revealed that certified seed samples exclusively harbored non-pathogenic fungi, specifically Aspergillus niger, Aspergillus flavus and Penicillium spp. These fungi exhibited varying frequencies of occurrence, with Aspergillus niger at 46%, Aspergillus flavus at 100% and Penicillium spp. at 54%. These findings underscore the prevalence of Aspergillus flavus across all seed categories, indicating its pervasive nature as a potential threat to common bean seed contamination. The presence
of non-pathogenic fungi in certified seed samples suggests a contrasting fungal composition compared to other seed categories, which may have implications for seed quality and disease resistance. The absence of pathogenic fungi in certified seed samples probably is due to certification procedures imposed to all certified seeds which which ensure, field and laboratory seed quality standards are met.
A diverse range of fungal species was identified in Quality Declared Seeds (QDS) samples, comprising five pathogenic fungi and four non-pathogenic fungal species. Among the pathogenic fungal species detected, Fusarium pallidoroseum was the most prevalent, with an occurrence frequency of 88%. Additionally, Fusarium solani was found in 42% of the samples, followed by Fusarium equiseta at 17%, Fusarium moniliforme at 21%, and Myrothecium leuvotrichum at 38%.
These findings shed light on the fungal composition present in QDS seed samples, highlighting the predominance of pathogenic fungi such as Fusarium species. The detection of multiple pathogenic fungal species underscores the potential risks posed to seed health and crop productivity.
The results indicate a diverse array of twenty-two fungal species detected in Farm-Saved Seed (FSS) samples, each with varying frequencies of occurrence. Among these fungal species, Aspergillus flavus stood out with a high frequency of appearance, noted in 92% of the samples. Following closely were Fusarium moniliforme at 88% and Fusarium pallidoroseum at 75%, ranking as the top three fungi species found in the majority of FSS seed samples.
The prevalence of Aspergillus flavus, Fusarium moniliforme, and Fusarium pallidoroseum in FSS seed samples highlights the significance of these fungal species in seed health and quality. These findings underscore the potential risks associated with fungal pathogens in farm-saved seeds and the importance of implementing effective seed management practices to minimize contamination and preserve crop yield.
Understanding the distribution and frequency of these fungal species in FSS seed samples is crucial for developing targeted disease control measures and ensuring seed viability. By identifying the key pathogens present and their respective frequencies of occurrence, farmers can take proactive steps to safeguard seed health and optimize crop production.
Comparatively, the findings reveal that the farm-saved seed (FSS) category which is Informal seeds exhibited the highest percentage of infected seeds, followed by QDS and Certified seeds. This suggests that seeds sourced from farm-saving practices may be more susceptible to fungal pathogens compared to seeds obtained from quality declared seed (QDS) or certified sources. The higher susceptibility of FSS to fungal contaminations might be due to absence of quality control done in farm saved seeds compared to certified and QDS seeds. This agrees with the previous study by Hlatshwayo et al.19 who detected increased incidence of disease pathogens from seed samples sourced from an informal seed source. Understanding these differences is crucial for seed selection and management strategies to mitigate the risk of seed-borne diseases. Moreover, the variation in seed contamination among different locations underscores the impact of environmental factors on fungal pathogen incidence. Factors such as climate, soil conditions, and agricultural practices can influence the level of seed contamination, highlighting the importance of location-specific management approaches to minimize fungal pathogen spread. Ochichi et al.20 discovered variation in fungal contamination based on geographical locations, which relate to variation in fungal contamination detected in this study which showed variation in fungal contaminations among sample collection districts.
According to the Seed Regulation 2007, among the identified seed-borne pathogens, Colletotrichum spp. is the only pathogen of seed health significance.
CONCLUSION
Certified seed samples showed a lower frequency of seed-borne pathogen infections compared to farm-saved seeds and QDS seed samples. However, neither the formal nor informal seed systems were able to produce seed samples free of seed-borne pathogens. Given that seed companies distribute seeds over large distances, unlike the informal seed system, they pose a greater risk for spreading diseases and potentially introducing them to new areas if current shortcomings in seed quality control are not addressed.
This research provides an extensive list of fungi present in common bean seed samples from the Southern Highlands of Tanzania. As a result, it is recommended that responsible authorities make seed dressing mandatory for all seeds sold by seed companies, alongside implementing the necessary measures to enforce this regulation effectively.
REFERENCES
- Nassary, E.K., F. Baijukya and P.A. Ndakidemi, 2020. Intensification of common bean and maize production through rotations to improve food security for smallholder farmers. J. Agric. Food Res., 2.
- Lisciani, S., S. Marconi, C. le Donne, E. Camilli and A. Aguzzi et al., 2024. Legumes and common beans in sustainable diets: Nutritional quality, environmental benefits, spread and use in food preparations. Front. Nutr., 11.
- Ojiem, J.O., 2018. Improving Cultivation Practices for Common Beans. In: Achieving Sustainable Cultivation of Grain Legumes, Sivasankar, S. (Ed.), Burleigh Dodds Science Publishing, England, ISBN: 9781351114370, pp: 41-72.
- Carbas, B., N. Machado, D. Oppolzer, L. Ferreira and M. Queiroz et al., 2020. Nutrients, antinutrients, phenolic composition, and antioxidant activity of common bean cultivars and their potential for food applications. Antioxidants, 9.
- Mecha, E., M.E. Figueira, M.C.V. Patto and M. do Rosário Bronze, 2018. Two Sides of the Same Coin: The Impact of Grain Legumes on Human Health: Common Bean (Phaseolus vulgaris L.) as a Case Study. In: Legume Seed Nutraceutical Research, Jimenez-Lopez, J.C. and A. Clemente (Eds.), IntechOpen, London, United Kingdom, ISBN: ISBN: 978-1-78985-398-8.
- Uebersax, M.A., K.A. Cichy, F.E. Gomez, T.G. Porch and J. Heitholt et al., 2023. Dry beans (Phaseolus vulgaris L.) as a vital component of sustainable agriculture and food security-A review. Legume Sci., 5.
- Katungi, E., A. Farrow, J. Chianu, L. Sperling and S. Beebe, 2009. Common bean in Eastern and Southern Africa: A situation and outlook analysis. Int. Cent. Trop. Agric., 61: 1-44.
- Kalima, P., D.M. Lungu and M. Mataa, 2021. Morphophysiological responses of common bean (Phaseolus vulgaris L.) genotypes to water stress. J. Agric. Biomed. Sci., 5: 1-17.
- Hillocks, R.J., C.S. Madata, R. Chirwa, E.M. Minja and S. Msolla, 2006. Phaseolus bean improvement in Tanzania, 1959-2005. Euphytica, 150: 215-231.
- Franke, A.C., F. Baijukya, S. Kantengwa, M. Reckling, B. Vanlauwe and K.E. Giller, 2016. Poor farmers-poor yields: Socio-economic, soil fertility and crop management indicators affecting climbing bean productivity in Northern Rwanda. Exp. Agric., 55: 14-34.
- Mukankusi, C., B. Raatz, S. Nkalubo, F. Berhanu and P. Binagwa et al., 2019. Genomics, genetics and breeding of common bean in Africa: A review of tropical legume project. Plant Breed., 138: 401-414.
- Kator, L., A.T. Ogo-Oluwa and A.B. Kemi, 2016. Isolation and identification of seed borne fungi of common bean (Phaseolus vulgaris L.) from selected markets in Makurdi. Int. J. Appl. Agric. Sci., 2: 75-78.
- Doyer, L.C., 1938. Manual for the Determination of Seed-Borne Diseases. 1st Edn., International Seed Testing Association, Wageningen, The Netherlands, Pages: 58.
- Mathur, S.B. and O. Kongsdal, 2003. Common Laboratory Seed Health Testing Methods for Detecting Fungi. International Seed Testing Association, Bassersdorf, Switzerland, ISBN-13: 9783906549354, Pages: 425.
- Ghiasian, S.A., P. Kord-Bacheh, S.M. Rezayat, A.H. Maghsood and H. Taherkhani, 2004. Mycoflora of Iranian maize harvested in the main production areas in 2000. Mycopathologia, 158: 113-121.
- Broughton, W.J., G. Hernández, M. Blair, S. Beebe, P. Gepts and J. Vanderleyden, 2003. Beans (Phaseolus spp.)-model food legumes. Plant Soil, 252: 55-128.
- Ochran, M. K., R.D. Narla, J.W. Muthomi and J.O. Ochuodho, 2020. The effect of seed source and post-harvest practices on quality of soybean (Glycine max) seeds in Busia County. Afr. Phytosanitary J., 2: 17-40.
- Francisco, F.G. and R. Usberti, 2008. Seed health of common bean stored at constant moisture and temperature. Sci. Agric., 65: 613-619.
- Hlatshwayo, S.I., A.T. Modi, S. Hlahla, M. Ngidi and T. Mabhaudhi, 2021. Usefulness of seed systems for reviving smallholder agriculture: A South African perspective. Afr. J. Food Agric. Nutr. Dev., 21: 17581-17603.
- Ochichi, P.B., J.W. Muthomi and J.M. Wagacha, 2018. Contribution of seed quality to the occurrence of fungal and bacterial diseases of farmer produced common bean in varied agro-climatic zones of Western Kenya. Am. J. Agric. Sci., 5: 19-27.
How to Cite this paper?
APA-7 Style
Sengele,
S.I., Msuya,
D., Njau,
P. (2026). Comparative Incidence of Fungal Pathogens in Common Bean Seeds from Formal and Informal Sources. Research Journal of Seed Science, 19(1), 1-12. https://doi.org/10.3923/rjss.2026.01.12
ACS Style
Sengele,
S.I.; Msuya,
D.; Njau,
P. Comparative Incidence of Fungal Pathogens in Common Bean Seeds from Formal and Informal Sources. Res. J. Seed Sci 2026, 19, 1-12. https://doi.org/10.3923/rjss.2026.01.12
AMA Style
Sengele
SI, Msuya
D, Njau
P. Comparative Incidence of Fungal Pathogens in Common Bean Seeds from Formal and Informal Sources. Research Journal of Seed Science. 2026; 19(1): 1-12. https://doi.org/10.3923/rjss.2026.01.12
Chicago/Turabian Style
Sengele, Samwel, I., Danstan Msuya, and Paul Njau.
2026. "Comparative Incidence of Fungal Pathogens in Common Bean Seeds from Formal and Informal Sources" Research Journal of Seed Science 19, no. 1: 1-12. https://doi.org/10.3923/rjss.2026.01.12

This work is licensed under a Creative Commons Attribution 4.0 International License.
